
| What's ADMETlab
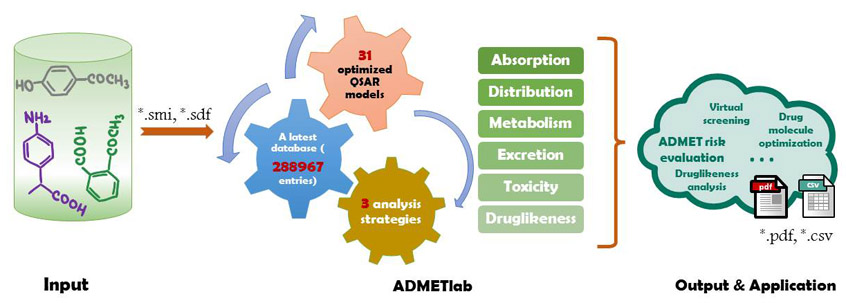
ADMETlab platform provides a user-friendly, freely available web interface for systematic ADMET evaluation of chemical compounds based on a comprehensive database consisting of 288,967 entries. It contains four main modules: 'Druglikeness analysis', 'ADMET prediction', 'Systematic evaluation' and 'Smilarity searching'. The detailed information about these modules is described as below.
| Main features
- Comparative large datasets of most properties.
- Better and robust SAR/QSAR models.
- Systematic analysis and comparison
- Provide constructive suggestions for molecular optimization
- Batch computation
- User-friendly interface
| Main functionalities
Druglikeness analysis.
ADME/T evaluation.
Similarity searching based on ADME/T database.
Systematic ADME/T assessment.
| Druglikeness rules
Druglikeness rules are several expert criterions that are used in drug design for how "druglike" a substance is with respect to factors like bioavailability. Here, we selected 5 commonly used rules and provided to users:
- Lipinski's rules:
MW<=500; logP<=5; Hacc<=10; Hdon<=5 - Ghose's rules:
- 5.6< MclogP < -0.4 mean: 2.52; 160 < MW < 480 mean: 357;40 < MR < 130 mean: 97; 20 < natoms < 70 mean: 48 - Oprea's rules:
nrings≥3; nrigidbond>=18; nRotbond≥6 - Veber's rules:
nRotbond<=10; tPSA<= 140 or Hacc and Hdon<=12 - Varma's rules:
MW<= 500; tPSA<=125; -5< logD < – 2; Hacc+Hdon<=9; nRotbond<=12
| Druglikeness model
We collected 6731 drugs from Drugbank database as samples of druglikeness. Then 6769 molecules were picked as negative samples from those molecules with IC50 or Ki less than 10000nm from CHEMBL database by using Self-organizing feature Mapping (SOM) method. The SOM method ensures that the nagetive samples are picked from the similar clusters compared with positive samples. This tend to make the model have a better discriminatory power and a proper application domain. Finally, we get a classification model with a accuracy of 0.801 for training set by 5-fold cross validation. This model can not only find out the active compounds from chemical entities but also distinguish the potential drug candidates from active compounds.
| Data summary
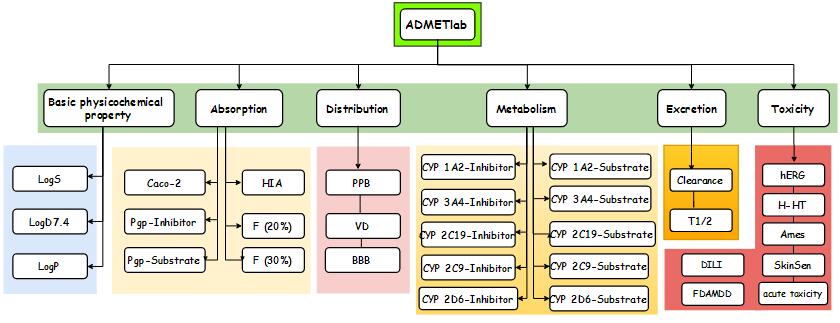
For all the ADMET-related properties, we collected corresponding data mainly by two approaches: the previous literatures and the DrugBank database (http://www.drugbank.ca). After several pretreatments, we totally obtained 30 datasets. The global overview of these ADMET datasets can be seen in the table below. (Table S1).
Table S1. The number of end-points of each property
| Category | Property | Total | Positive | Negative | Train | Test |
| Basic physicochemical property | LogS | 5220 | - | - | 4116 | 1104 |
| LogD7.4 | 1031 | - | - | 773 | 258 | |
| LogP | ||||||
| Absorption | Caco-2 | 1182 | - | - | 886 | 296 |
| Pgp-Inhibitor | 2297 | 1372 | 925 | 1723 | 574 | |
| Pgp-Substrate | 1252 | 643 | 609 | 939 | 313 | |
| HIA | 970 | 818 | 152 | 728 | 242 | |
| F (20%) | 1013 | 759 | 254 | 760 | 253 | |
| F (30%) | 1013 | 672 | 341 | 760 | 253 | |
| Distribution | PPB | 1822 | - | - | 1368 | 454 |
| VD | 544 | - | - | 408 | 136 | |
| BBB | 2237 | 540 | 1697 | 1678 | 559 | |
| Metabolism | CYP1A2-Inhibitor | 12145 | 5713 | 6432 | 9145 | 3000 |
| CYP1A2-Substrate | 396 | 198 | 198 | 297 | 99 | |
| CYP3A4-Inhibitor | 11893 | 5047 | 6846 | 8893 | 3000 | |
| CYP3A4-Substrate | 1020 | 510 | 510 | 765 | 255 | |
| CYP2C19-Inhibitor | 12272 | 5670 | 6602 | 9272 | 3000 | |
| CYP2C19-Substrate | 312 | 156 | 156 | 234 | 78 | |
| CYP2C9-Inhibitor | 11720 | 3960 | 7760 | 8720 | 3000 | |
| CYP2D6-Inhibitor | 12726 | 2342 | 10384 | 9726 | 3000 | |
| CYP2C9-Substrate | 784 | 278 | 506 | 626 | 156 | |
| CYP2D6-Substrate | 816 | 352 | 464 | 611 | 205 | |
| Excretion | Clearance | 544 | - | - | 408 | 136 |
| T1/2 | 544 | - | - | 408 | 136 | |
| Toxicity | hERG | 655 | 451 | 204 | 392 | 263 |
| H-HT | 2171 | 1435 | 736 | 1628 | 543 | |
| Ames | 7619 | 4252 | 3367 | 5714 | 1905 | |
| SkinSen | 404 | 274 | 130 | 323 | 81 | |
| LD50 of acute toxicity | 7397 | - | - | 5917 | 1480 | |
| DILI | 475 | 236 | 239 | 380 | 95 | |
| FDAMDD | 803 | 442 | 361 | 643 | 160 |
| Data sources
The models are avaliable for public via: http://github.com/ifyoungnet/ADMETlab, other datasets or resources please email oriental-cds@163.com; biomed@csu.edu.cn to get download link.
| Model summary
To obtain robust and reliable QSAR models for ADMET properties prediction, we constructed a series models and aimed to find a best one. Six methods (RF, SVM, RP, PLS, NB, DT) and seven types of descriptors (2D, Estate, MACCS, ECFP2, ECFP4, ECFP6, FP2) were applied in the modeling process. The best model for each property and its performance can be seen in tables below (Table S2, Table S3).
| Model Results
Table S2. The best regression models for the coressponding ADME/T related properties
| Property | Method | Features | mtry | R2 | Q2 | R2T | RMSEF | RMSECV | RMSET |
| LogS | RF | 2D | 10 | 0.995 | 0.967 | 0.957 | 0.138 | 0.369 | 0.436 |
| LogD7.4 | RF | 2D | 14 | 0.983 | 0.877 | 0.874 | 0.228 | 0.614 | 0.605 |
| LogP | |||||||||
| Caco-2 | RF | 2D | 14 | 0.973 | 0.845 | 0.824 | 0.121 | 0.289 | 0.290 |
| PPB | RF | 2D | 8 | 0.954 | 0.691 | 0.682 | 7.124 | 18.443 | 18.044 |
| Property | Method | Features | mtry | 2-fold rate (CV/Test) | 3-fold rate (CV/Test) |
| VD | RF | 2D | 10 | 0.819/0.801 | 0.912/0.904 |
| CL | RF | 2D | 10 | 0.760/0.816 | 0.877/0.897 |
| T1/2 | RF | 2D | 12 | 0.762/0.699 | 0.897/0.824 |
| LD50 of acute toxicity | RF | 2D | 5 | 0.986/0.987 | 0.998/0.997 |
Table S3. The best classification models for the coressponding ADME/T related properties
| Property | Method | Features | Five-fold cross validation | External validation dataset | ||||||
| Sensitivity | Specificity | Accuracy | AUC | Sensitivity | Specificity | Accuracy | AUC | |||
| HIA | RF | MACCS | 0.820 | 0.743 | 0.782 | 0.846 | 0.801 | 0.743 | 0.773 | 0.831 |
| F (20%) | RF | MACCS | 0.731 | 0.647 | 0.689 | 0.759 | 0.680 | 0.663 | 0.671 | 0.746 |
| F (30%) | RF | ECFP6 | 0.743 | 0.605 | 0.669 | 0.715 | 0.751 | 0.601 | 0.667 | 0.718 |
| BBB | SVM | ECFP2 | 0.962 | 0.813 | 0.926 | 0.948 | 0.993 | 0.854 | 0.962 | 0.975 |
| Pgp-inhibitor | SVM | ECFP4 | 0.887 | 0.789 | 0.848 | 0.908 | 0.863 | 0.802 | 0.838 | 0.913 |
| Pgp-substrate | SVM | ECFP4 | 0.839 | 0.807 | 0.824 | 0.899 | 0.826 | 0.854 | 0.840 | 0.905 |
| CYP1A2-Inhibitor | SVM | ECFP4 | 0.833 | 0.864 | 0.849 | 0.928 | 0.853 | 0.880 | 0.867 | 0.939 |
| CYP1A2-Substrate | RF | ECFP4 | 0.768 | 0.636 | 0.702 | 0.801 | 0.768 | 0.637 | 0.702 | 0.802 |
| CYP3A4-Inhibitor | SVM | ECFP4 | 0.759 | 0.858 | 0.817 | 0.901 | 0.788 | 0.860 | 0.829 | 0.909 |
| CYP3A4-Substrate | RF | ECFP4 | 0.798 | 0.716 | 0.757 | 0.835 | 0.819 | 0.679 | 0.749 | 0.835 |
| CYP2C19-Inhibitor | SVM | ECFP2 | 0.826 | 0.819 | 0.822 | 0.893 | 0.812 | 0.825 | 0.819 | 0.899 |
| CYP2C19-Substrate | RF | ECFP4 | 0.735 | 0.744 | 0.740 | 0.816 | 0.871 | 0.667 | 0.769 | 0.853 |
| CYP2C9-Inhibitor | SVM | ECFP4 | 0.719 | 0.898 | 0.837 | 0.900 | 0.730 | 0.882 | 0.830 | 0.894 |
| CYP2C9-Substrate | RF | ECFP4 | 0.746 | 0.709 | 0.728 | 0.819 | 0.746 | 0.709 | 0.734 | 0.824 |
| CYP2D6-Inhibitor | RF | ECFP4 | 0.770 | 0.811 | 0.793 | 0.868 | 0.771 | 0.812 | 0.795 | 0.882 |
| CYP2D6-Substrate | RF | ECFP4 | 0.765 | 0.73 | 0.748 | 0.823 | 0.792 | 0.73 | 0.76 | 0.833 |
| hERG | RF | 2D | 0.908 | 0.700 | 0.844 | 0.879 | 0.888 | 0.762 | 0.848 | 0.873 |
| H-HT | RF | 2D | 0.780 | 0.520 | 0.689 | 0.710 | 0.785 | 0.487 | 0.681 | 0.683 |
| Ames | RF | MACCS | 0.800 | 0.841 | 0.820 | 0.890 | 0.848 | 0.816 | 0.834 | 0.897 |
| SkinSen | RF | MACCS | 0.685 | 0.727 | 0.706 | 0.760 | 0.715 | 0.727 | 0.731 | 0.774 |
| DILI | RF | MACCS | 0.866 | 0.813 | 0.840 | 0.904 | 0.830 | 0.857 | 0.843 | 0.910 |
| FDAMDD | RF | ECFP4 | 0.848 | 0.812 | 0.832 | 0.904 | 0.853 | 0.782 | 0.821 | 0.892 |
The Cohen's kappa coefficient can be used as a performance metric to evaluate the results of models based on unbalanced dataset. Here we calculated the coefficient for the 7 unbalanced models: {CYP2C9-Substrate: 0.397, CYP2D6-Inhibitor: 0.506, CYP2D6-Substrate: 0.411, F-20: 0.309, F-30: 0.254, HIA: 0.429, SkinSen: 0.413} . Usually, the coefficient standards: (<=0: poor; 0.01-0.20: slight; 0.21-0.40: fair; 0.41-0.60:moderate; 0.61-0.80: substantial; 0.81-1: almost perfect). We can see, after the processing using our strategies, the consistency is quite acceptable.
| Database contents
The database integrated all the ADMET entries from ChEMBL database, Drugbank database, EPA database and related records from several literatures along with all the data described above. We manually checked the correctness of the values and dropped redundant information which resulted in 288,967 entries. Each entry includs basic molecular properties( eg. , common name, SMILES, ALogp, PSA) and ADMET activities.
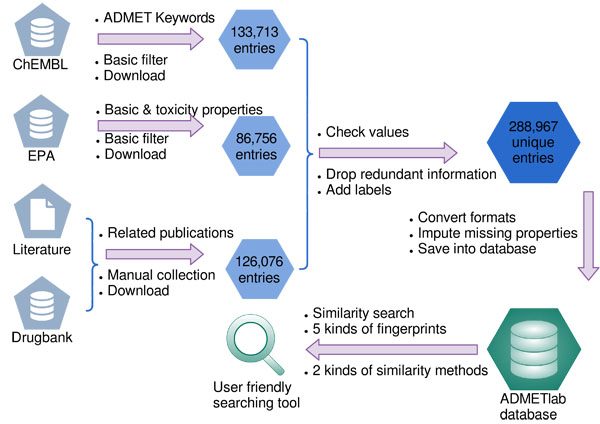
| Similarity search
QSAR models and similarity search are both useful strategies to predict ADMET properties. Compared with QSAR models, The similarity search in databases are fast and can easily be extended to include new information. Here, we provides 5 kinds of fingerprints to represent molecular information and 2 kinds of similarity metrics. Users can input molecules to estimate their properties by comparing with similar compounds.
| Summary
Not just one property affects the behavior of drugs in body. Usually we are looking for molecules that possess relatively good performance through every stage of ADME/T. Here, we developed this module that allows users to evaluate most aspects of ADME/T process of one molcule. The results provide users an full impression and lead to constructive suggestions of molecular optimization.
Table S4. The explaination for the coressponding ADME/T related properties
The recommended browsers: Safari, Firefox, Chrome,IE(Ver.>8).
ADMETlab is licensed under a Creative Commons Attribution-NonCommercial-ShareAlike 4.0 International License.  E-mail: jiedong@csu.edu.cn
 |
 |
 |
 |
|
 |